March 07, 2014
New Maps and Open Data Pave Way for Nairobi BRT
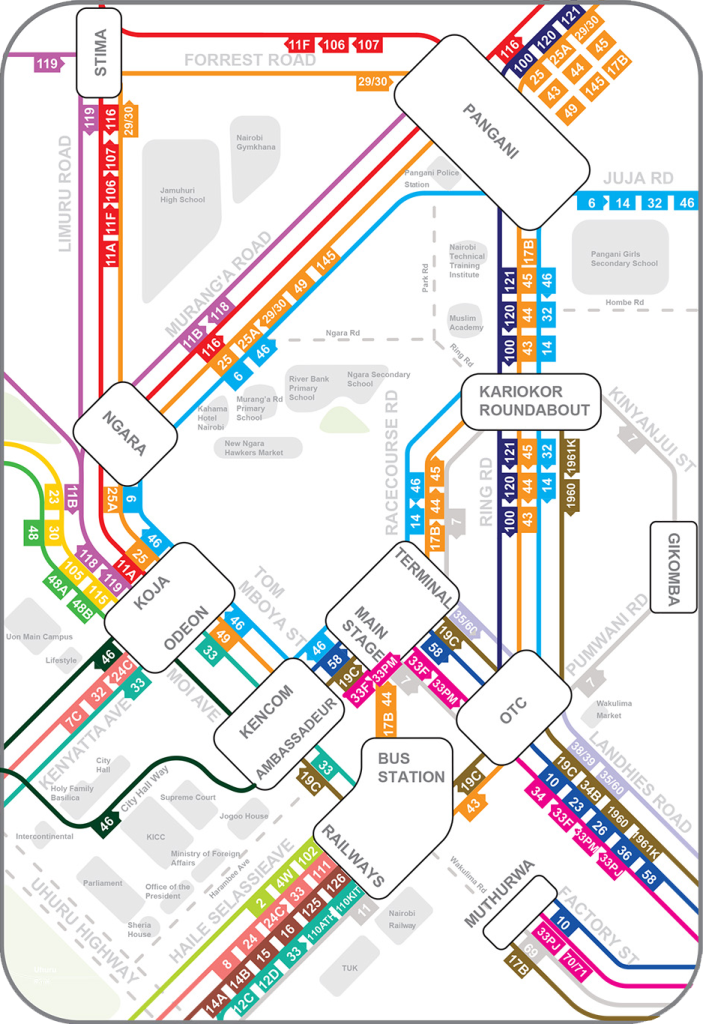
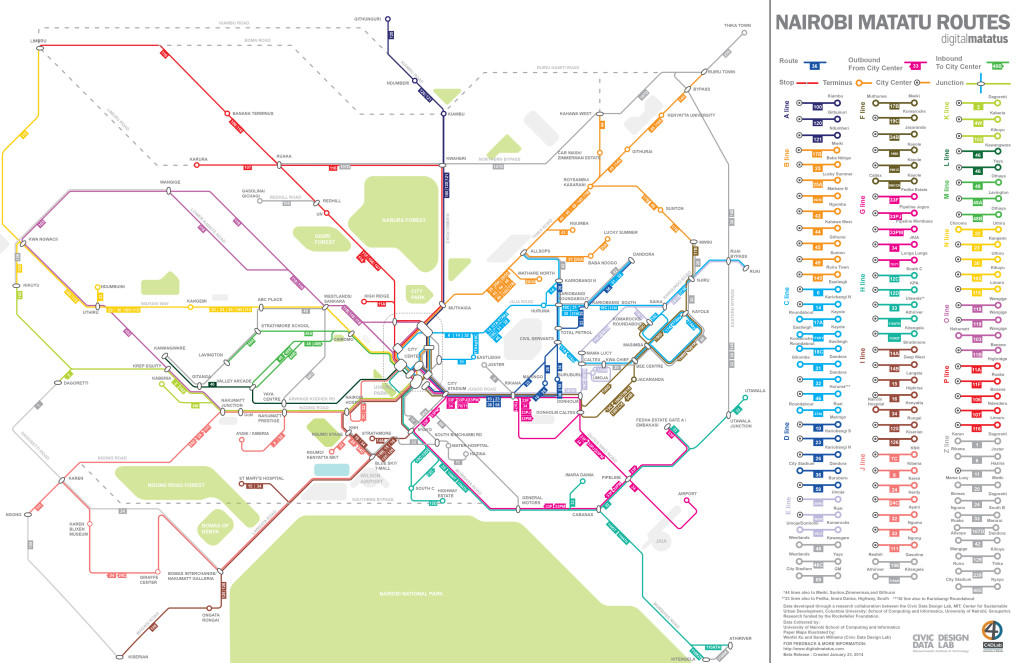
 If a picture is worth a thousand words, a map is worth a million. Recently released research on transit patterns in Nairobi puts the power of a map in the hands of the people and urban planners. Using data they collected, the Digital Matatus project, a collaboration between students and professors at Columbia, MIT, the University of Nairobi and design firm Groupshot, published a map showing graphically for the first time the routes and stops of Nairobi’s informal matatu minibus system.
The map not only illuminates the complex and oftentimes confusing system that moves nearly a million people every day, but provides a basis for the future of transportation planning in Kenya’s capital. Immediately, this new data is proving useful and important, as ITDP incorporates the information into models and recommendations for Nairobi’s first ever BRT corridor.

The new map provides important insight into transit patterns of Nairobi’s travelers. With a clearer view of the system’s routes and transfer locations, matatu riders can find easier paths to their destinations. While the map is most well-known for providing useful information to the general public, its underlying data is proving equally useful to planners and local government officials in understanding current travel patterns and enhancing their ability to plan for the future.
Critically, the researchers entered the data into the open format General Transit Feed Specification (GTFS), a common format for public transportation schedules that allows the data to be used for travel apps and system modeling. Along with exciting projects in Dkaha, Manila and Mexico City, the Nairobi project is one of the first to bring informal transit into GTFS, allowing more dynamic trip planning for users and advanced network analysis for planners.

